In mining projects, there are two common fears:
"The budget looked great on paper, but implementation brought endless change orders."
"The pipeline was installed, only to discover it's not wear-resistant, hard to maintain, and consumes too much energy."

A slurry pipeline may look like "just a few kilometers of pipe," but its cost chain is extensive-materials, installation, pump stations, energy consumption, maintenance, downtime risk, and more. If any link is overlooked, it eventually turns into hidden project losses.
So the question, "How should slurry pipeline costs be analyzed?" is not merely a financial issue-it's an integrated engineering problem.
In this article, we'll clearly explain how slurry pipeline costs should be broken down, calculated, and compared.

First: What Exactly Are You Calculating?
When people hear "cost analysis," they often think:
Purchase price + installation cost.
That only gives you a quotation figure-not the true investment return cycle.
For slurry pipeline systems, costs should be divided into at least three layers:
CAPEX (Capital Expenditure): What you buy, build, and install
OPEX (Operating Expenditure): What it costs to run daily
Risk & Opportunity Costs: Losses from downtime, pipe bursts, maintenance windows, environmental or safety incidents
If you're preparing a project budget, CAPEX carries more weight.
If you're calculating life-cycle cost, OPEX and risk costs must be included.
In abrasive slurry systems, the real expense often lies not in the day you buy it-but in the years you operate it.

Define the Product Clearly: What Is the Slurry Pipeline Transporting?
Clear definition creates cost boundaries.
A slurry pipeline transports solid-liquid two-phase media. This determines:
Wear mechanisms
Pressure loss
Pumping methods
Maintenance frequency
Before cost estimation, the following parameters must be fixed (or at least bounded):
Slurry concentration and particle size distribution
Flow rate and transport distance
Terrain and elevation difference
Operating stability (start-stop frequency, pressure fluctuation)
Corrosiveness of the medium
Cost estimation is not about plugging numbers into a formula-it starts with clearly defining operating conditions.

The Six Cost "Buckets" of a Slurry Pipeline System
To make cost accounting executable, divide it into six major categories:
1. Pipe Material & Lining Costs (Most Visible)
Pipe body material (steel, composite, etc.)
Wear-resistant lining
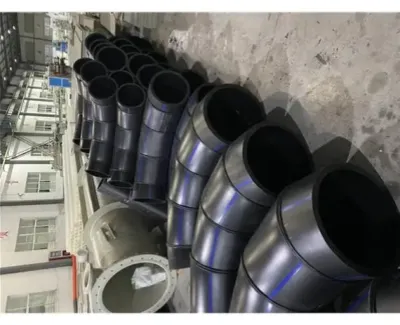
Fittings (elbows, tees, reducers, flanges, couplings)
Note: Elbows are often major wear hotspots. Many projects underestimate their proportion and cost.
2. Construction & Installation Costs
Civil excavation, backfilling, supports
Welding/connection, lifting, NDT inspection
Coating, anti-corrosion, marking
Pressure testing and commissioning
Installation costs vary dramatically depending on terrain-mountainous regions, deserts, pipe racks, road or river crossings.
3. Pump Station & Power System Costs
A slurry pipeline does not "flow by itself."
Costs include:
Pump selection
Motor power
VFD systems
Valves and instrumentation
Energy consumption is critical. Ignoring 3–5 years of electricity costs means you haven't truly calculated total cost.
4. Operating Energy & Consumables
Electricity
Wear parts (impellers, liners, seals, valve components)
Lubrication, cooling, flushing
Common mistake: Calculating equipment lifespan but ignoring efficiency degradation due to wear. As resistance increases, electricity consumption rises-a long-term hidden expense.
5. Maintenance & Downtime Costs (Most Overlooked)
Maintenance includes:
Labor and lifting
Spare parts inventory
Production downtime
Temporary bypass systems
If design improvements reduce maintenance time from two days to half a day, the savings are not just repair costs-they are production capacity.
6. Safety, Environmental & Compliance Costs
Slurry leaks or bursts may trigger:
Environmental damage
Shutdown losses
Regulatory penalties
Reputational impact
Even if precise numbers are difficult, risk scenarios must be evaluated.
How to Build a Practical Cost Model (Three Steps)
Step 1: Define System Boundaries
Calculate the entire system:
Feed tank → Pump station → Pipeline → Valve groups → Terminal distribution → Monitoring system.
Clear boundaries prevent omissions.
Step 2: Use Life Cycle Cost (LCC)
A practical formula:
**LCC = Initial Investment
(Annual Energy + Annual Maintenance) × Service Years
Expected Risk Loss
– Residual Value**
Always compare alternatives under the same lifecycle period (e.g., 5 or 8 years).
Step 3: Create Two Comparison Tables
Cost Comparison Table
Equipment, materials, construction, pump systems, energy, maintenance
Risk Comparison Table
Burst probability, wear rate, maintenance frequency, downtime duration, spare availability
Side-by-side comparison makes decision-making clearer.
Translating "Product Advantages" into Cost Impact
Avoid generic claims like "wear-resistant" or "long service life."
Instead, translate advantages into cost categories:
Higher wear resistance → Lower maintenance & downtime cost
Easier connection → Lower installation & maintenance labor cost
Lower friction coefficient → Reduced energy cost
Strong system integration → Fewer mismatches & shorter commissioning period
Product advantages must correspond to specific cost reductions.
When Is Detailed Cost Analysis Especially Important?
Projects with:
Long distance & high elevation differences
High concentration & coarse particles
Frequent start-stop conditions
Continuous production lines
Difficult construction environments
In such cases, wrong selection leads to ongoing losses-not minor overspending.
Four Practical Implementation Tips
Reduce assumptions-collect real operating data.
Evaluate high-wear sections separately.
Compare energy consumption per ton or per cubic meter.
Clearly define supplier scope to avoid change orders.
About Luoyang Zhengju:
Why Does a Manufacturer's Capability Affect Your Total Cost?
In projects involving slurry conveyance pipelines, suppliers do more than just "sell materials"; they also influence your subsequent installation efficiency, maintenance complexity, spare parts availability, and system stability. Often, the real difference lies not in the price per meter, but in "delivery completeness" and "engineering capabilities."
Taking Luoyang Zhengju as an example, if you factor the following capabilities into your cost analysis, you'll get a more accurate picture of the true costs:
Installation efficiency
Maintenance difficulty
Spare parts availability
System stability
The real difference often lies not in price per meter, but in engineering completeness and delivery capability.
Evaluate suppliers on:
System-level solution capability
Complete component supply
Product consistency
Delivery & service responsiveness
Spare parts support
Supplier strength directly affects cost certainty.
The Bottom Line: Cost Accounting Is About Certainty
Many projects fail not due to lack of budget-but due to cost uncertainty.
Don't focus only on purchase price.
Break costs down by life cycle.
Define system boundaries clearly.
Compare risks alongside expenses.
Every assumption made during budgeting becomes a real expenditure curve after commissioning.